

Procedure
- Copy, download, or locate a PolicyServer installation package on the endpoint
you have installed PolicyServer on.To download the PolicyServer installation package or the Endpoint Encryption Suite, go to the Trend Micro Download Center:
- Go to
<PolicyServer Directory>\TMEE_PolicyServer\Tools\Diagnostics
                           Monitor
. - Run the file
DiagnosticMonitor.exeas an administrator.The License Renewal Tool screen opens.
Important
Windows may encounter an error titled Xenocode Postbuild 2010 at this point. The message text states that the application is unable to load a required virtual machine component. If this error occurs, open Windows Update, remove the updateKB3045999
, and try to run Diagnostic Monitor again. - Go to .The Live Monitor Options screen appears.
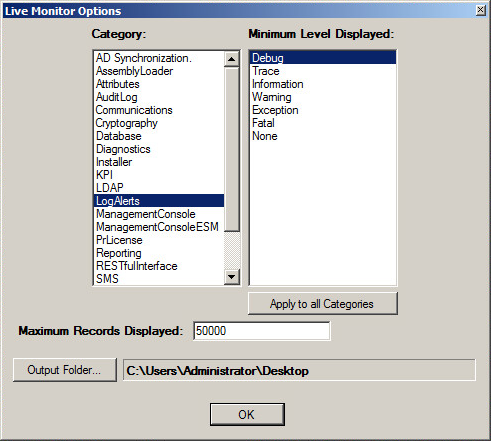
- Go to LogAlerts and set the Minimum Level Displayed to Debug.
- Set the Maximum Records Displayed field to a value between
3000
and50000
.After setting the Maximum Records Displayed value, an event may appear in Diagnostic Monitor stating that the system is out of memory. If this event appears, return to this window and set the Maximum Records Displayed to a lower value. - Click Apply to all Categories or select individual categories and apply specific settings to each of them.
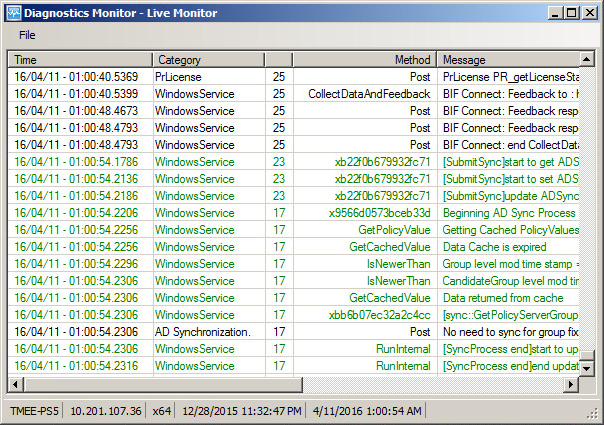
- Restart the service PolicyServerWindowsService from Windows Task Manager.When the PolicyServer service restarts, Active Directory synchronizes with PolicyServer. The Diagnostic Monitor will display events related to Active Directory synchronization.
- View the logs in the Diagnostic Monitor window.
- If you are using Diagnostic Monitor to troubleshoot a specific issue, perform all tasks necessary to replicate that issue while Diagnostic Monitor is open.
- To generate a file of the diagnostic logs, go to .A log file appears at your selected output folder. The default output folder is the desktop. To change your selected output folder, go to .The name of the file is a timestamp of when you generated the file and the format is PSDM.

Note
If you contact Trend Micro Support regarding an issue, the support representative may request that you send a copy of the diagnostic logs for bug verification.