

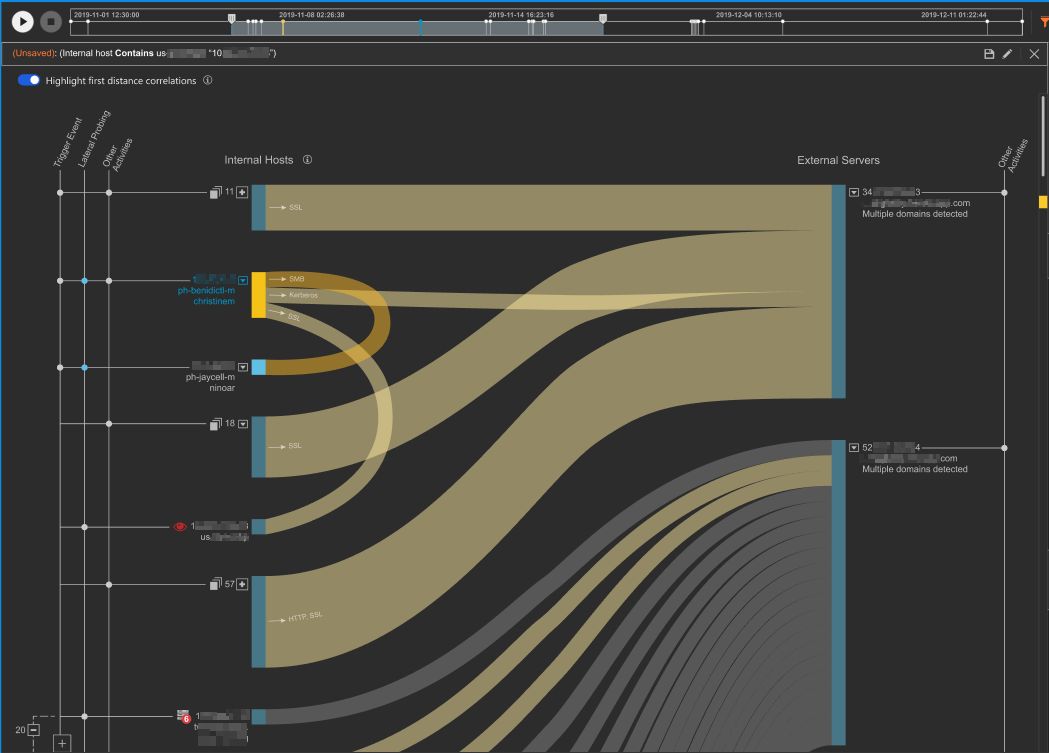
View a visual representation of relationships between the trigger object and related objects.
The Correlation Graph provides an interactive visual graph you can use to investigate security events.
There are several tools and actions you can take to focus on objects and relationships.
|
Detail
|
Description
|
Available actions
|
|
Playback bar
|
The playback bar provides a historical review of the events and connections detailed
in the Network Analytics report
|
Click play, pause, or stop to control the playback.
Use the time sliders to limit the events displayed in the correlation graph to the
specific time frame.
|
|
Advanced search filter
|
Advanced search filters provide customization to find specific events or objects in
the correlation graph
|
Click the filter icon (
|
|
Correlation line
|
Correlation lines show the relationships between internal hosts, IoCs, and other objects
detected by the network analytics report
|
Click a correlation line to filter the details provided in Transactions and IOCs
|
|
Internal hosts
|
Internal hosts are endpoints and other network devices located within your network
The graph identifies internal hosts by internet protocol (IP address) as well as host
name and user are, if known.
Icons representing relevant information might appear next to an internal host. For
example, if the internal host is on the Priority Server List or on a Trusted Service
Source List, the graph displays the appropriate icon. For more information, see Network Resource Lists.
|
Hover over the actions icon (
|
|
External servers
|
External servers are IP addresses, domains, and other related objects detected by
Network Analytics
External servers are
identified by IP address; the domain name is also
supplied if known.
Email senders are identified
by email address and are always displayed at the
top of the External Servers side.
Other relevant
information might be displayed for external
hosts.
|
Hover over the actions icon (
|
|
Activity legend
|
The activity legend identifies key activities for the internal host and external server
participants in the graph.
|
-
|
|
Participant icons
|
Participant icons help show which activities each internal host or external server
participated in
You can determine the activities in
which each internal host or external server participated
by checking the presence of an icon in the corresponding
activity column.
|
Hover over an internal
host or external server to see the activities in
which they are participants highlighted in
blue.
|