Figure 1. Playback Bar / Time Slider

Click on the playback bar to view the
time line for the correlated events. Deep Discovery
Director - Network Analytics draws the oldest
correlation event first and continues through to the
latest correlation.
Use the time line sliders to view
correlated events over a selected time frame. The graph
displays only the correlations within the selected time
frame.
-
Adjust the
time frame by clicking on the left and right grab
bars on the time line and dragging them to the
desired location.
-
To move the
entire time frame, click inside the current time
frame and drag the frame toward the left or the
right.
-
The
correlations displayed in the graph (and resultant
transaction details) change according to event
data found within the selected time frame.
|
|
Click on the filter icon ( ) located next
to the Playback Bar to display
or hide the advanced search filter. ) located next
to the Playback Bar to display
or hide the advanced search filter.
Use the advanced search
filter to create and apply customized searches.
For details, see Correlation Graph Advanced Search Filter.
|
|
Correlation Line
Each correlation graph contains one or
more correlation lines that correlate malicious or
suspicious activity between a source and
destination.
-
Each correlation
line represents one or more transactions between
two hosts.
-
The thickness
of the line is proportional to the number of
transactions occurring between the hosts.
-
Correlation lines can be
between an internal host and external server or
between two internal hosts (lateral movement).
-
Each correlation
line is labeled with the protocols used in
transactions between the hosts. An arrow within
the correlation line indicates the direction of
the transactions, from source to destination.
Correlation lines involving
email senders are labeled as Suspicious
Email Activity.
|
|
Internal
hosts
-
Internal hosts are identified
by IP address; the host name and logged on user
are also supplied if known.
Icons
representing relevant information might be
displayed next to an internal host. For example,
if the internal host is on the priority watch list
or on a registered service list, the graph
displays the appropriate icon.
-
Hover over the downward
triangle icon ( )
located next to each internal host and external
server to view a list of additional actions you
can perform for that host. )
located next to each internal host and external
server to view a list of additional actions you
can perform for that host.
-
Deep Discovery Director
attempts to retrieve an endpoint analysis report
for hosts on the priority watch list and for the
host that is the Interested IP in the trigger
event. If there is a report, the icon is located
beneath the internal host. Click on the Endpoint Analysis Report icon
( ) to
open the report provided by Apex Central. ) to
open the report provided by Apex Central.
Note:
-
Deep Discovery Director
must be integrated with Apex Central before the
Endpoint Analysis Report
icon becomes available in the correlation
graph.
For details, see Configuring Apex Central Settings.
|
|
External servers
-
External servers are
identified by IP address; the domain name is also
supplied if known.
Email senders are identified
by email address and are always displayed at the
top of the External Servers side.
Other relevant
information might be displayed for external
hosts.
-
Hover over the
downward triangle icon ()
located next to each external server to view a
list of additional actions you can perform for
that host.
-
Copy to clipboard: Copy the value to your clipboard.
-
View network detection events: Open the
Network Detections
screen in a new browser tab with filters matching this object applied.
-
Threat Connect: Open
Trend Micro Threat Connect
in a new browser tab with a query for this object.
-
DomainTools (WHOIS): Open
DomainTools
in a new browser tab with a query for this IP address or domain.
-
VirusTotal: Open
VirusTotal
in a new browser tab with a query for this object.
|
|
Special
Icons
Additional icons provide information
about elements in the correlation graph.
-
Priority
Watch List icon: 
-
Endpoint Analysis Report icon:
Deep Discovery Director
attempts to retrieve an endpoint analysis report
for hosts on the priority watch list and for the
host that is the Interested IP in the trigger
event. If there is a report, the icon is located
beneath the internal host.
Deep Discovery Director
(Consolidated Mode) retrieves the report from Apex
Central, which is integrated with Apex One. Apex
One provides the endpoint sensor feature.
There are
several statuses for retrieving the report:
|
|
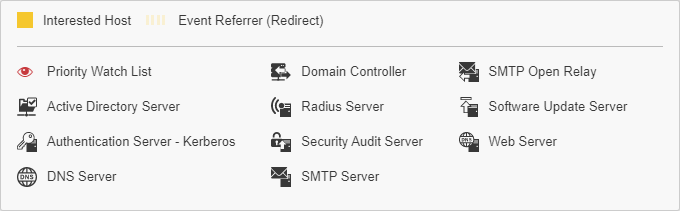
Legend
Provides a list of icons used in the
correlation graph, including the following:
-
The color of the correlation line
for the interested host
-
Whether the graph contains hosts on
the priority watch list
-
Registered services icons indicating
that the hosts in the graphs are members of that
list
Figure 2. Legend
|
|
Interested
Host
Represents the focal point of this
correlated event.
The interaction is generally between
an internal host and external server and is identified
by the yellow line connecting the source and
destination.
Note:
Suspicious Object detections
selected from Deep Discovery Director
generally do not generate a Interested
Host correlation.
|
|
Activity Legend
Identifies key activities for the internal host and external server participants in the graph.
-
Activities vary for each
specific correlation graph.
-
Can include activities similar
to the following: Brute Force Authentication,
C&C Callback, Data Exfiltration, Lateral
Movement, Malicious Transfer, Other Malicious
Activities, and Vulnerability Exploit.
-
Some activities correspond to
"Reason" in Deep Discovery
Inspector logs.
|
|
Participant Icons
You can determine the activities in
which each internal host or external server participated
by checking the presence of an icon in the corresponding
activity column.
Hover over an internal
host or external server to see the activities in
which they are participants highlighted in
blue.
|

