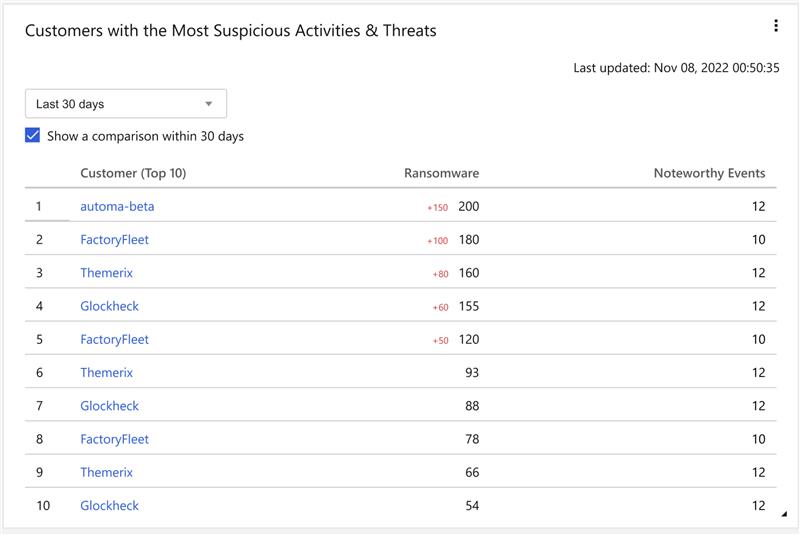
This widget displays the top ten customers with the most suspicious activities and
threats.

Use the drop-down menu to select from the following time frames:
-
Last 7 days
-
Last 30 days
Select the comparison checkbox to display the difference in number of detections from
the
start of the specified time frame until the present in red.
Click the name of any customer and go to the Risk Management tab to view
the risk trending chart and detailed device information.
For more information, see Customer Risk Management.

