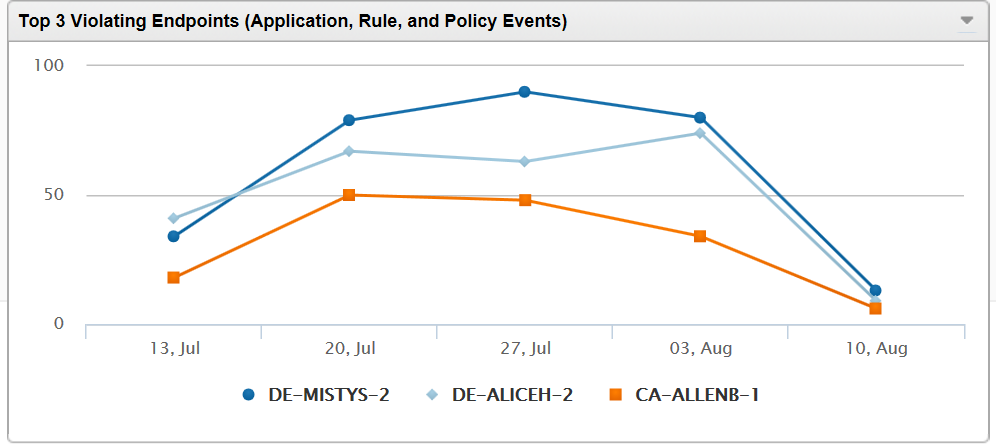
Use this widget to display a distribution summary of Endpoint Application Control application events based on selected criteria.

Go to Dashboard and then select Widget Settings from the menu on the top-right of the widget to do the following tasks:
|
Task |
Steps |
|---|---|
|
Name widget. |
Under Title, type a name. Tip:
Leave this field blank to allow Apex Central to name the widget based on your configuration. |
|
Select template. |
Under Template, select a template. See About Templates. |
|
Edit data scope. |
Under Log type, select a scope for data displayed by the widget. Figure 2. Data
Scope
 |
|
Edit period. |
Under Period, select a period for widget data. |
|
Edit data source. |
Figure 3. Data
Source
|
|
Limit displayed results. |
Select Advanced. Under Limit results to the following, use dynamic search.  |
|
Change chart type. |
Under Display, select one of the following types of chart:
|
|
Change chart size. |
To the right of the chart types, select one of the following a chart sizes:
Figure 4. Chart
Size
 Note:
This control is not available if |
|
Change legend location. |
Under Legend, select one of the following locations:
Note:
This control is not available if |
|
Display chart controls on widget. |
Select the Toolbar check box. |
|
Hide chart controls on widget. |
Clear the Toolbar check box. (default) |
|
Display data summary table below chart. |
Select Data summary table below chart. |
|
Hide data summary table below chart. |
Clear Data summary table below chart. (default) |
|
Save configuration as new template. |
Under Template, select |
This widget includes the following customizable templates:
Only one template can be displayed at a time.
|
"Template" |
"Log type" |
Scope (Default) |
"Period" (Default) |
"Advanced" Data Column (Default) |
"Advanced" Dynamic Search (Default) |
|---|---|---|---|---|---|
|
Applications without Rules |
Application Event Important:
This data matches the log type "Policy actions". |
Top 3 |
Last 14 days |
Name |
Rule is Empty |
|
Applied Policies |
Application Event Important:
This data matches the log type "Policy actions". |
Top 3 |
Last 14 days |
Policy |
Policy is Not Empty |
|
Blocked Applications |
Application Event Important:
This data matches the log type "Policy actions". |
Top 3 |
Last 14 days |
Name |
Action Taken is Blocked |
|
Used Applications |
Application Event Important:
This data matches the log type "Policy actions". |
Top 3 |
Last 14 days |
Name |
Action Taken is Allowed |
|
Violated Policies |
Application Event Important:
This data matches the log type "Policy actions". |
Top 3 |
Last 14 days |
Policy |
Policy is Not Empty AND Action Taken is Blocked |
|
Violated Rules |
Application Event Important:
This data matches the log type "Policy actions". |
Top 3 |
Last 14 days |
Name |
Rule is Not Empty AND Action Taken is Blocked |
|
Violating Endpoints |
Application Event Important:
This data matches the log type "Policy actions". |
Top 3 |
Last 14 days |
Endpoint Name |
Action Taken is Blocked |
|
Violating Users |
Application Event Important:
This data matches the log type "Policy actions". |
Top 3 |
Last 14 days |
User Name |
Action Taken is Blocked |


