

The details pane on the Operation Center tab displays more detailed information about the compliance levels, critical threat detections, and total resolved/unresolved events on your network.
The default view displays the selected compliance indicator information for all nodes on your network for the last 7 days.
-
Select a different compliance indicator to change the compliance information that displays.
For more information, see Compliance Indicators.
-
Click a node on the chart to display only the information for the selected node.
For more information, see Operation Center Chart.
-
Click the settings icon (
 >
>  ) to change the Period for the data that displays.
|
Indicator |
Description |
|---|---|
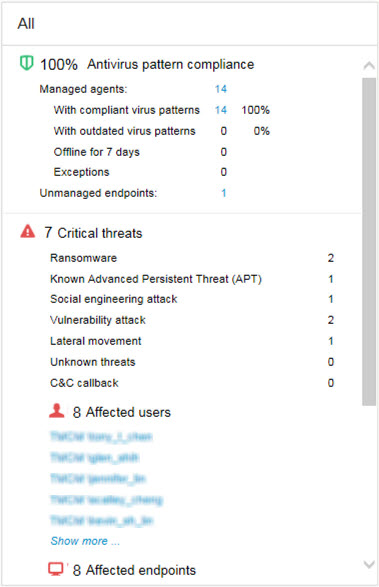
|
Antivirus pattern compliance |
Displays the percentage of Security Agents using acceptable Virus Pattern and Smart Scan Agent Pattern versions You can also view the following details:
Expand the categories and click a count to view additional details about the affected endpoints. For more information, see the following topics: |
|
Data Loss Prevention compliance |
Displays the percentage of Data Loss Prevention enabled Apex One agents with an acceptable number of threat detections You can also view the following details:
Expand the categories and click a count to view additional details about the affected endpoints. For more information, see the following topics: |
|
Section |
Description |
|---|---|
|
Critical threats |
Displays the total number of critical threats detected (by threat type) on your network Lists all the critical threat types affecting your network For threat types with detections:
|
|
Affected users |
Displays the total number of users affected by critical threats
|
|
Affected endpoints |
Displays the total number of endpoints affected by critical threats
|
|
Data |
Description |
|---|---|
|
Total events |
Displays the total number of events detected |
|
Resolved events |
Displays the number of resolved events on your network |
|
Unresolved events |
Displays the number of unresolved events on your network that require action |
|
Affected users |
Displays the number of users affected by unresolved events on your network Click the count to view details about the affected users. For more information, see User/Endpoint Directory. |