

Procedure
- Select Logs from the left menu, and select the kind of log you want to view.
- The Stored Logs section of the screen displays the number of logs currently in the log database, and the date range of the stored logs, if any.
- Specify the viewing query criteria for the desired logs.
-
Data Range: Select among the commonly specified date ranges: All dates, Today, Yesterday, Past 7 days or Past 30 days. If the period you require is not covered by the above options, choose Specified date range; this enables the Start date and End date fields.
-
Start date: Type the earliest log you want to view. Select the Specified date range option in Data Range to use this criterion. The month-day-year format is used. Alternatively, click the calendar icon (
 ) and select a date
from the calendar.
) and select a date
from the calendar. -
End date: Type the latest log you want to view. Select the Specified date range option in Data Range to use this criteria. The month-day-year format is used. Alternatively, click the calendar icon () and select a date
from the calendar.
-
Sort by: Specify the order and grouping of the logs. Options for groups are: Date/Time, Virus Name, Scan Type, Action Result, and Source Files; the order may either be ascending or descending.
-
Entries per page: From the drop-down menu, select the number of logs to display at a time. Choose a setting that is appropriate for your monitor resolution. The values range from 15 to 200, the default value is 25.

Note
You can increase the number of “logs to be queried” in the configuration file. See "MaxRetrieveCount" in Logs Group Key Set for more information. -
- Click Display Log to begin the query.See the following figure for an example of the scan log:
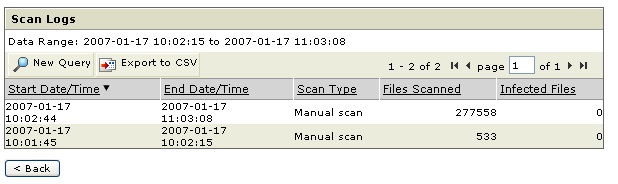
Scan log example See the following figure for an example of the virus log: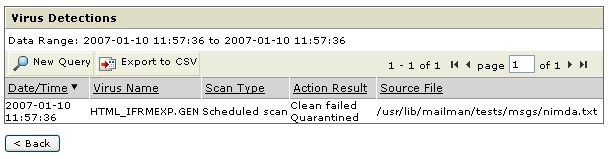
Virus log example See the following figure for an example of the system log.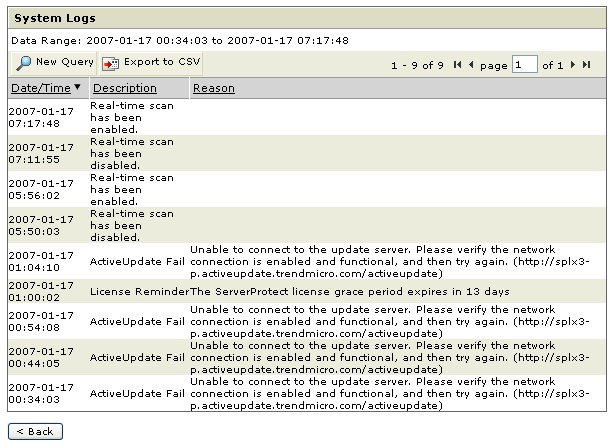
System log example To exit the log and start a new log query, click . To export the results
of your log query to a .csv file, click
. To export the results
of your log query to a .csv file, click  . Navigate to the first,
previous, next, and last page of the log query results by clicking the
navigation arrows (
. Navigate to the first,
previous, next, and last page of the log query results by clicking the
navigation arrows ( ). To refresh the data,
use the refresh function of the web browser for this frame. Upon refresh,
the log query screen may add new data to the query, depending on the type of
query you selected. For example, if you originally requested today’s logs
several hours ago, refresh this screen. Any activity that occurred between
the previous query and the refresh are added to the log results.
). To refresh the data,
use the refresh function of the web browser for this frame. Upon refresh,
the log query screen may add new data to the query, depending on the type of
query you selected. For example, if you originally requested today’s logs
several hours ago, refresh this screen. Any activity that occurred between
the previous query and the refresh are added to the log results.