

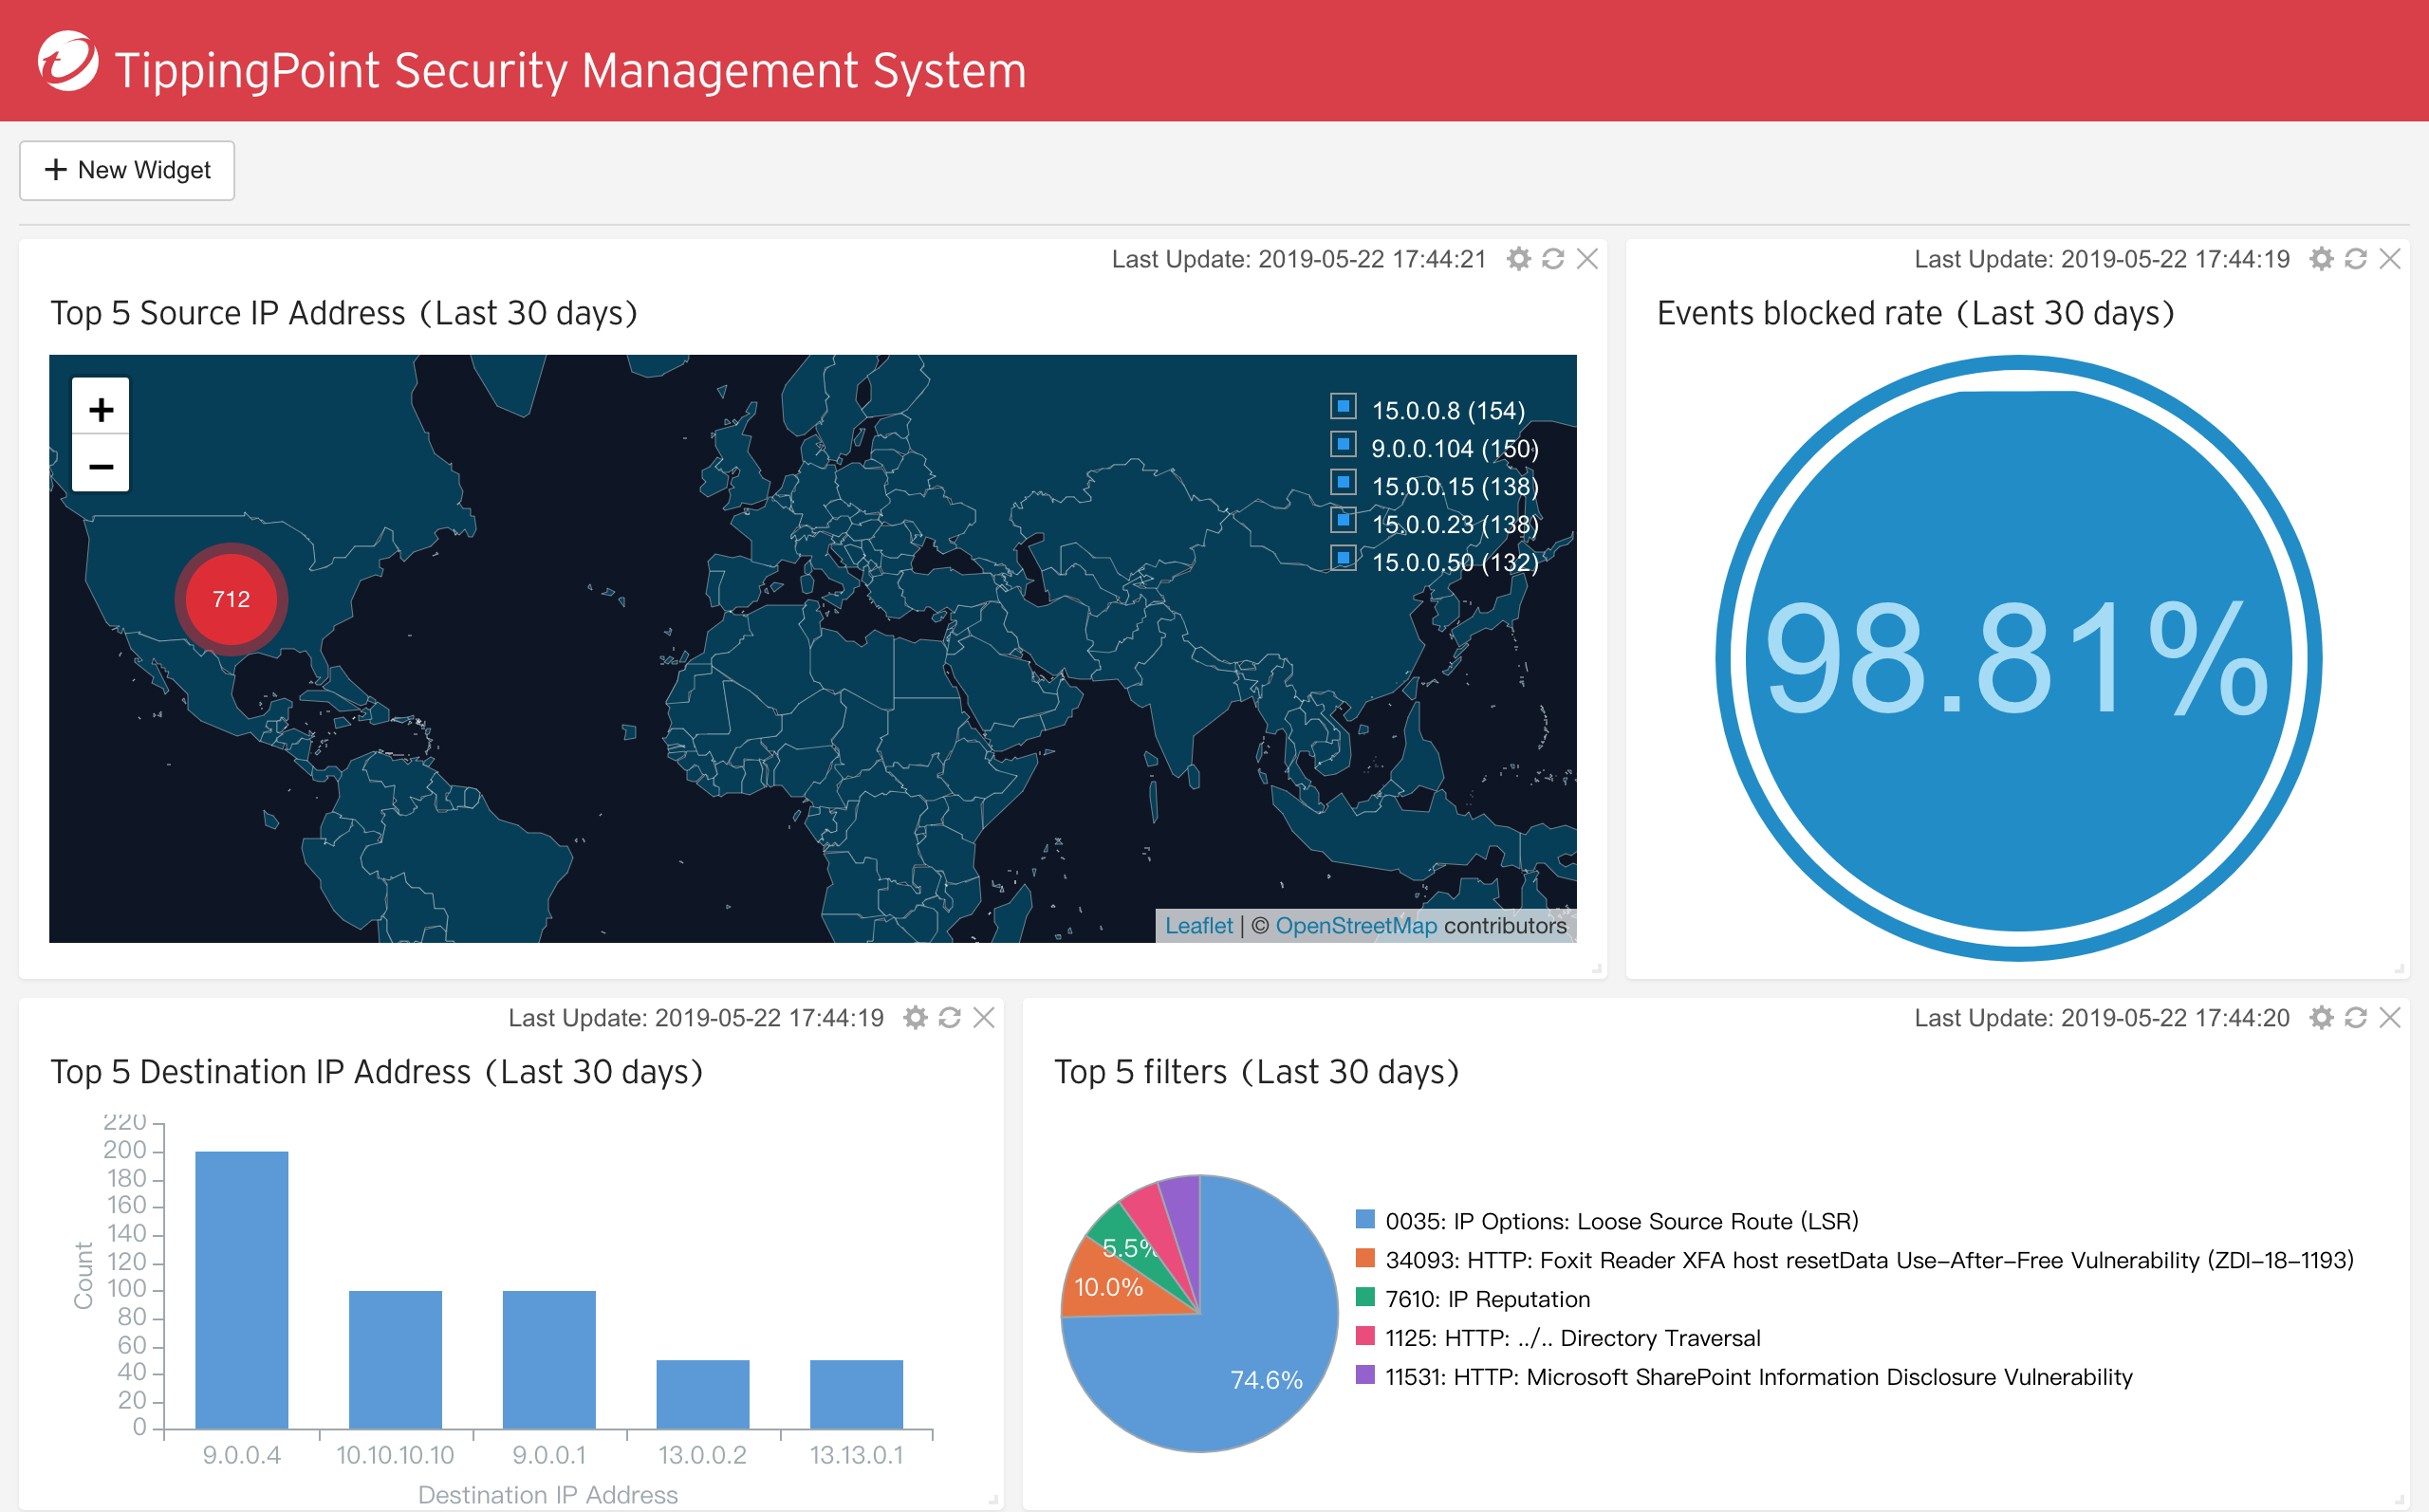
You can use the SMS Web Dashboard to continuously display the information that is
most important for mornitoring your network, such as the ability to monitor geographic
locations
of an attack on a map. The SMS Web Dashboard alerts you when there is an issue on
your network.
When you need to take action, you can drill down quickly to view the details of an
alert.
The SMS Web Dashboard is configured with several widgets. You can customize the
existing widgets or add additional widgets to display the information that you need
to monitor.
By default, the dashboard contains the following widgets: Top Attack Sources, Top
Filters, and
Events Blocked Rate.
To access this feature, open a supported browser (the most current version of Mozilla
Firefox,
Microsoft Edge, Apple Safari, or Google Chrome), and then enter https://<SMS IP
address or host name>/d/Dashboard.
To refresh the widget, click the Refresh icon at the top of
the widget. To edit a widget, click the Gear icon and then select
parameters or visualization options. To remove the widget from the dashboard, click
the
X icon.