

Use Filters for Review to make strategic changes to your security policy according to filter factors relevant to the policy.
By providing operational, security, and performance contexts, this interface
enables you to target your filters to known active threats.
Using the detailed context provided for each filter, you can maximize the
effectiveness of your security policy by:
- Fine-tuning your policies to enable only those filters that are relevant to your environment
- Negotiating the tradeoff between higher security and higher performance
- More efficiently blocking bad traffic without hampering good traffic
- Identifying the conditions surrounding congestion
A red badge next to the navigation panel's Profiles icon alerts you that you have
profiles with filters that have been flagged for review. When you click the Profiles
icon, the
expanded navigation shows another badge next to Filters for Review that indicates
how many
filters have been flagged.
Refer to the following image of the Dashboard.
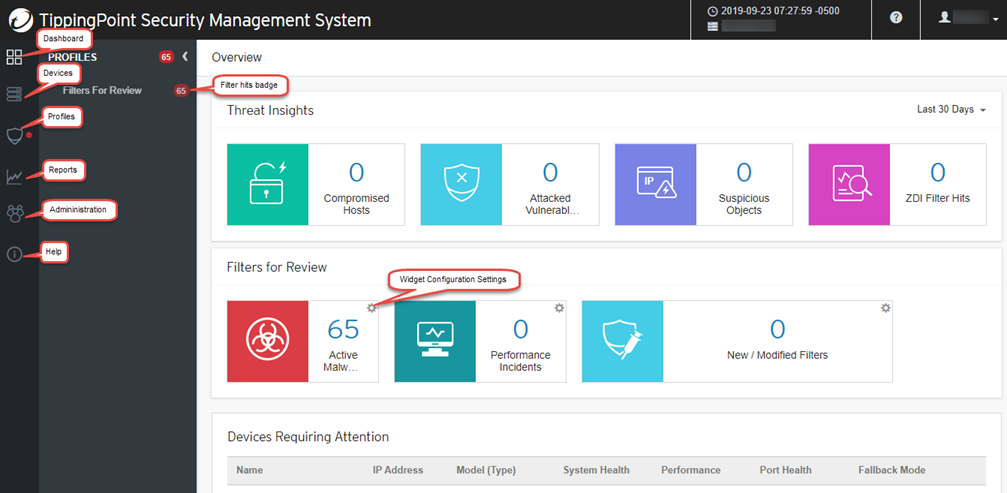
Filters are automatically flagged for review according to the criteria
identified by the following Dashboard widgets:
- Active Malware Threats – Real-world malware that actively exploits network vulnerabilities.
- Performance Incidents – Traffic-based anomalies, such
as Adaptive Filter Configuration (AFC) events.

Note
To display performance incidents, configure your device for AFC and distribute at least one profile to the device. Because the polling that associates distributed profiles with your device runs every five minutes, expect a corresponding delay before performance incidents are displayed. - New / Modified Filters – New filters or enhancements to existing filters provided in a Digital Vaccine (DV) or Auxiliary DV package.
NoteA filter remains flagged until the
malware threat gets demoted as a top threat or expires. For new and modified filters,
there
is no expiration.
|
When you click the Dashboard widget you want to review, a list of filters for
that category is displayed. Active Malware filters are displayed in order of security
importance; other filters are displayed sequentially by filter number. You can narrow
the list
by Flag Type, Review Status, and
Snooze Status on the toolbar.
To determine a filter's security importance, the Trend SMART Protection Network (SPN)
compiles security information from a conglomeration of sources. After it ranks the
threats,
SPN then combines the data with TippingPoint Digital Vaccine (DV) intelligence for
the final
output, which is provided to the SMS by the Threat Management Center (TMC). A filter's
final
ranking on the list depends on a number of factors. For example, a filter with a minor
severity can be higher on the list than a filter with a critical severity if it has
a higher
prevalence.
From the list, click a filter to see an overview of it, including:
- Information about the filter's function
- Release/modification dates
- Severity
- Source
- Category
- CVE identifications
The context panel to the right of the console displays the following tabs with
details of how the filter is used in your security policy:
- Flags – List of flags associated with the filter, and
when that flag occurred. You can change the review status of this filter's flag by
clicking the Actions drop-down menu. If you want to re-evaluate
this flag later, set the action to Snooze and select a time period.
If you have the required permissions, click the Add Flag button to
add your own custom flag.
Note
You can edit filter settings only within the context of a profile using the SMS client. If you do edit a filter's settings, remember to also use the SMS client to redistribute all profiles that contain that filter. - Performance – An interactive graph is displayed
showing filter activity in correlation to a device's CPU congestion over a period
of time
that you specify. Although you can configure this for up to 20 devices, only the top
10
devices with the highest correlation rates are used to calculate the data. To see
this
graph, configure Filter Performance Correlation on a device that has this filter enabled.
Learn
more. Hovering over different points in the graph presents congestion statistics,
including:
- The precise time reflected at that point on the graph.
- The percentage of congestion reflected at that point.
- The number of times the filter was triggered at that point.
Note
A trigger count of 0 (zero) indicates that this filter was not one of the 50 most-triggered filters for the specified time period. It does not reflect the actual number of filter triggers.
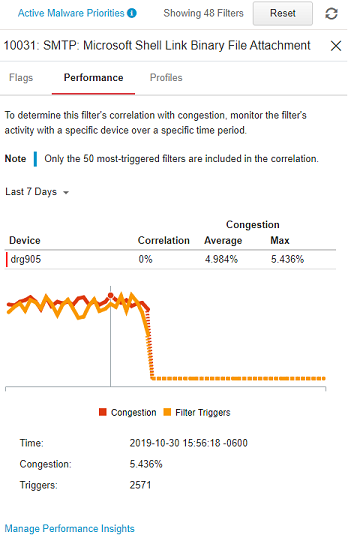 The performance table lists the device with the highest correlation at the top, and the graph you see is for that device. Because the data is dynamic, you might see the graph for a different device each time you refresh the page. To see the correlation graph for any other device, click the device in the table.Any portion of the graph showing a dashed line indicates that no data is available during the specified time period. Time, congestion, and trigger statistics will not be displayed.
 - Profiles – A list of profiles that use this filter, and, if the filter is in an Enabled state, the action set your profile has configured for the filter. A label of Recommended indicates that the recommended settings for the filter are applied.