The option allows you to generate any of the following charts in a column layout:
-
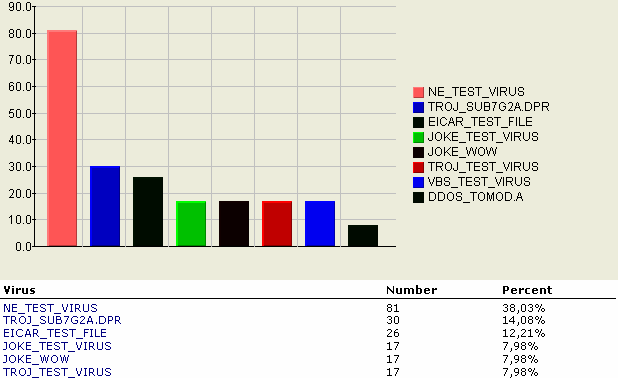
Detection Chart– provides the top 10 viruses detected.
-
Server Chart– provides information of the top 10 servers where most infections are detected.
-
User Chart– provides information of the top 10 users who sent the most viruses via email.
-
Database Chart– provides information of the top 10 infected databases.
To generate and view log statistics:
-
Do one of the following to open the Log Database:
-
From the ScanMail Configuration left menu, click Log Database.
-
Open
smvlog.nsf
-
-
From the Log Database left menu, click .
-
From the working area, select the chart type to generate and view.
-
Select a date, either All or a Date Range.
-
Click Generate Chart.The screen displays a column-type chart with the top ten values corresponding to the selected chart's total percentage count. If there are no logs in the Log database, no data will be available in a column type chart.