

|
Number
|
Description
|
|
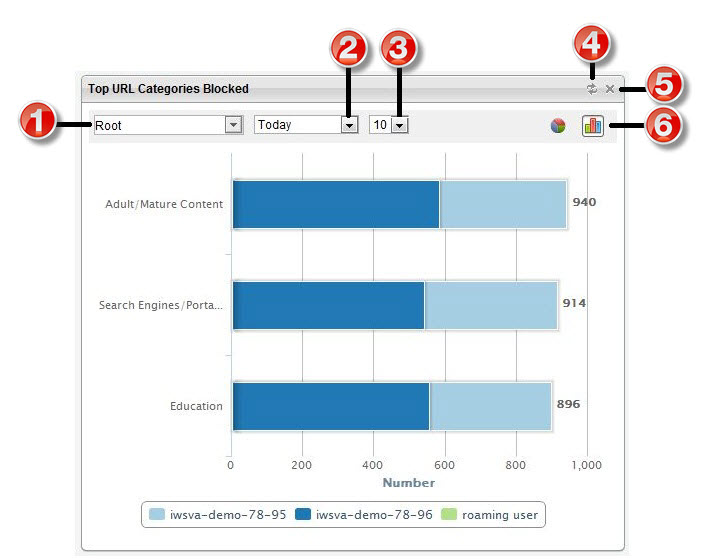
1
|
Select or search one gateway or gateway group to monitor. The default
group is Root.
|
|
2
|
Change the time period for displayed data: Today, Last 1 hour, Last 12 hours, Last
24 hours, and Last 7 days.
|
|
3
|
Change the Top entry to number of items to 5, 10, 15, or
20.
|
|
4
|
Manually refresh the displayed information.
|
|
5
|
Delete the widget from the tab.
|
|
6
|
Change the graphic format for displayed data: bar chart or pie graph.
|