

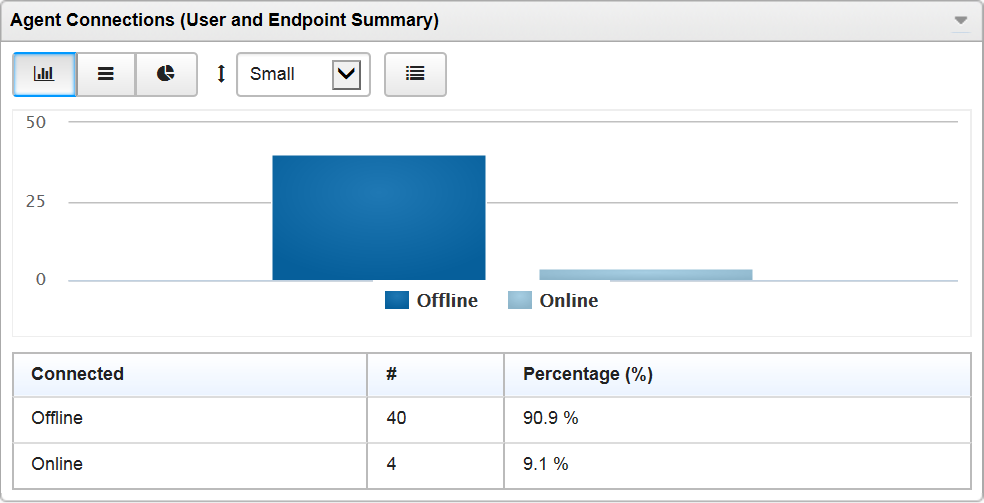
This widget displays a distribution summary of Endpoint Application Control users
and endpoints based on selected criteria, and includes customizable templates for
agent
connections, agent versions, endpoint Windows versions, policies, policy updates,
and rules.
Modify the templates by using custom settings.
Go to Dashboard and then select
Widget Settings from the menu on the top-right of the
widget to do the following tasks:
User and Endpoint Summary Widget Configuration Tasks
|
Task
|
Steps
|
||
|
Name widget.
|
Under Title, type a name.
|
||
|
Select template.
|
Under Template, select a template.
|
||
|
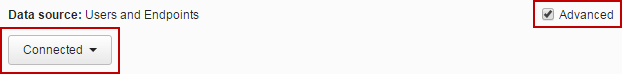
Edit data source.
|
Select Advanced.
Under Data source, select a data
source for data displayed by the widget.
 |
||
|
Limit displayed results.
|
Select Advanced.
Under Limit results to the following,
use dynamic search.
 |
||
|
Change chart type.
|
Under Display, select one of the
following types of chart:
|
||
|
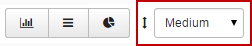
Change chart size.
|
To the right of the chart types, select one of the following a
chart sizes:
 |
||
|
Change legend location.
|
Under Legend, select one of the following
locations:
|
||
|
Display chart controls on widget.
|
Select the Toolbar check
box. (default)
|
||
|
Hide chart controls on widget.
|
Clear the Toolbar check box.
|
||
|
Display data summary table below chart.
|
Select Data summary table below
chart.
|
||
|
Hide data summary table below chart.
|
Clear Data summary table below
chart. (default)
|
||
|
Save configuration as new template.
|
Under Template, select
 Save current settings as template.
 |
||
|
Delete widget.
|
Select Close Widget from the menu on the
top-right of the widget.
The widget and any customizations you have made to the
widget's settings are deleted.
|
This widget includes the following customizable templates:
NoteOnly one template can be displayed at a time.
|
Template |
Data source |
Scope
|
Advanced Data Column (Default)
|
|
Agent Connections
|
Users and Endpoints
|
All (not user configurable)
|
Connected
|
|
Agent Versions
|
Users and Endpoints
|
Top 3
|
Agent Version
|
|
Endpoint Windows Versions
|
Users and Endpoints
|
Top 3
|
Windows Version
|
|
Policies
|
Users and Endpoints
|
Top 3
|
Policy
|
|
Policy Updates
|
Users and Endpoints
|
All (not user configurable)
|
Policy Updates
|
|
Rules
|
Users and Endpoints
|
Top 3
|
Rules
|