

This widget displays Endpoint Application Control key performance indicators
based on selected criteria, and includes customizable templates for applications detected
for the
first time, applications not in the Certified Safe Software list, average agents stopped,
average
endpoints not connected, block and lockdown rule.
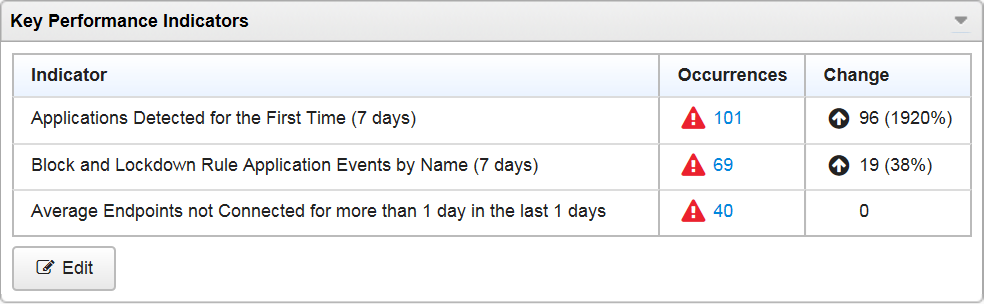
By default, the widget marks events as  )
at 5 occurrences and
)
at 5 occurrences and  ) at 10 occurrences.
Optionally, mark events as Important or Critical by customizing event thresholds.
) at 10 occurrences.
Optionally, mark events as Important or Critical by customizing event thresholds.
Important(
Critical(
See table Add or Edit Indicator
Tasks.
Go to Dashboard and then select
Widget Settings from the menu on the top-right of the
widget to do the following tasks:
KPI Widget Configuration Tasks
|
Task
|
Steps
|
|
Edit indicator trend calculation used by the widget.
|
The widget displays trends in the Change
column. The widget calculates indicator trends by comparing the current period with
an average of previous periods.
Under Trend Calculations, type a number of
previous periods to average.
The default setting is 1.
|
Go to Dashboard, locate this
widget, and then click Edit to do the following
indicator-related tasks. After completing tasks, click
Done.
KPI Widget Indicator Tasks
|
Task
|
Steps
|
|
Add new indicator.
|
|
|
Edit indicator.
|
|
|
Delete indicator.
|
Click
|
Add or Edit Indicator Tasks
|
Task
|
Steps
|
||
|
Name indicator.
|
Under Title, type a name.
|
||
|
Select template.
|
Under Template, select a template.
See About Templates.
|
||
|
Edit period.
|
Under Period, select a period for
indicator data.
|
||
|
Display threshold icons.
|
Select Enable thresholds.
|
||
|
Hide threshold icons.
|
Clear Enable thresholds.
|
||
|
Set
Important( |
Under Mark events as Important, type the
minimum number of event occurrences.
The icon displays in the
Occurrences column if the following are true:
|
||
|
Set
Critical( |
Under Mark events as Critical, type the minimum
number of event occurrences.
The icon displays in the
Occurrences column if the following are true:
|
This widget includes customizable templates for the following
indicators:
Template |
Log type |
By Occurrences Aggregated by Data Column
|
Period(Default) |
||
|
Applications Detected for the First Time
|
Trusted Applications
|
7 days
|
|||
|
Applications not in the Certified Safe Software
List
|
Policy Actions
|
7 days
|
|||
|
Average Agents Stopped
|
Clients Samplings
|
1 day
|
|||
|
Average Endpoints not Connected
|
Clients Samplings
|
More than 1 day in the last 1 day
|
|||
|
Block and Lockdown Rule Application Events
|
Policy Actions
|
|
7 days
|
||
|
Block Rule Application Events
|
Policy Actions
|
|
7 days
|
||
|
Lockdown Rule Application Events
|
Policy Actions
|
|
7 days
|
||
|
Uncategorized Applications Detected
|
Policy Actions
|
7 days
|