

Agents record when a protection module rule or condition is triggered (a security
event). Agents and Workload Security also records when administrative or system-related
events occur (a system event), such as an administrator logging in, or agent software
being upgraded. Event data is used to populate the various reports and graphs in Workload
Security.
To view events, go to Events & Reports in Workload Security.
Location of event logs
Location varies by the computer's operating system. On Windows, event logs are stored
in this location:
C:\Program Data\Trend Micro\Deep Security Agent\DiagOn Linux, event logs are stored here:
/var/opt/ds_agent/diagThese locations only contain standard-level logs; diagnostic debug-level logs have
a different location. For performance reasons, debug-level logging is not enabled
by default. You should only enable debug logging if diagnosing an issue with Trend
Micro technical support, and make sure to disable debug logging when you are done.
For more information, see Enabling detailed logging on Deep Security Agent.
Timing of sending events to Workload Security
Most events that take place on a computer are sent to Workload Security during the
next heartbeat operation except the following, which are sent right away if communication
settings allow relays or agents to initiate communication:
- Smart Scan Server is offline
- Smart Scan Server is back online
- Integrity Monitoring scan is complete
- Integrity Monitoring baseline created
- Unrecognized elements in an Integrity Monitoring Rule
- Elements of an Integrity Monitoring Rule are unsupported on the local platform
- Abnormal restart detected
- Low disk space warning
- Log Inspection offline
- Log Inspection back online
- Reconnaissance scan detected (if the setting is enabled in )
Storage of long events
Workload Security retains security events for 4 weeks and system events for 13 weeks.
If you require a longer event retention period, you should consider exporting events
to an external SIEM. For more information, see Forward Workload Security events to an external syslog or SIEM server.
Event history is retained for:
- Anti-Malware events
- Application Control events
- Firewall events
- Integrity Monitoring events
- Intrusion Prevention events
- Log Inspection events
- Web Reputation events
- System events
- Device Control events
System events
All the Workload Security system events are listed and can be configured on the tab. You can set whether to record the individual events and whether to forward them
to a SIEM system. For details on system events, see System events.
Security events
Each protection module generates events when rules are triggered or other configuration
conditions are met. Some of this security event generation is configurable. For information
on specific types of security events, refer to these articles:
- Anti-Malware events
- Identified files
- Application Control events
- Firewall events
- Integrity Monitoring events
- Intrusion Prevention events
- Log Inspection events
- Web Reputation events
- Device Control events
The firewall stateful configuration in effect on a computer can be modified to enable
or disable TCP, UDP, and ICMP event logging. To edit the properties of a stateful
firewall configuration, go to . The logging options are in the TCP, UDP, and ICMP tabs of the firewall stateful configuration's Properties window. For more information about firewall events, see Firewall events.
View events associated with a policy or computer
The Policy editor and the Computer editor both have Events tabs for each protection module. The policy editor displays events associated with
the current policy. The computer editor displays events specific to the current computer.
View details about an event
To see details about an event, double-click it.
The General tab displays the following:
- Time: The time according to the system clock on the computer hosting Workload Security.
- Level: The severity level of event that occurred. Event levels include Info, Warning, and Error.
- Event ID: The event type's unique identifier.
- Event: The name of the event (associated with the event ID.)
- Target: The system object associated with the event is identified here. Clicking the object's identification will display the object's properties sheet.
- Event Origin: The Workload Security component from which the event originated.
- Action Performed By: If the event was initiated by a user, that user's username will be displayed here. Clicking the username displays the User Properties window.
- Manager: The hostname of the Workload Security computer.
- Description: If appropriate, the specific details of what action was performed to trigger this event are displayed here.
The Tags tab displays tags that have been attached to this event. For more information on
event tagging, see , and Apply tags to identify and group events.
Filter the list to search for an event
The Period toolbar lets you filter the list to display only those events that occurred within
a specific time frame.
The Computers toolbar lets you organize the display of event log entries by computer groups or
computer policies.
Clicking toggles the display of the advanced search bar.
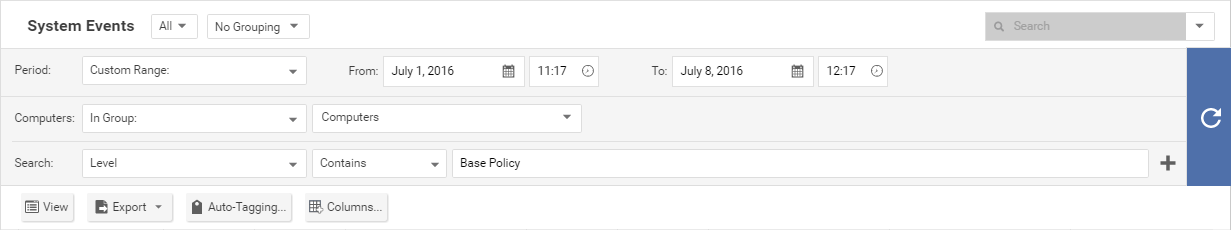
Clicking Add Search Bar (+) to the right of the search bar displays an additional search bar so you can apply
multiple parameters to your search. When you are ready, click Submit Request.
Export events
You can export displayed events to a CSV file (paging is ignored, all pages are exported).
You have the option of exporting the displayed list or the selected items.
Improve logging performance
You can maximize the performance of event collection:
- Reduce or disable log collection for computers that are not of interest.
- Consider reducing the logging of firewall rule activity by disabling some logging options in the firewall stateful configuration Properties window. For example, disabling the UDP logging eliminates the Unsolicited UDP log entries.