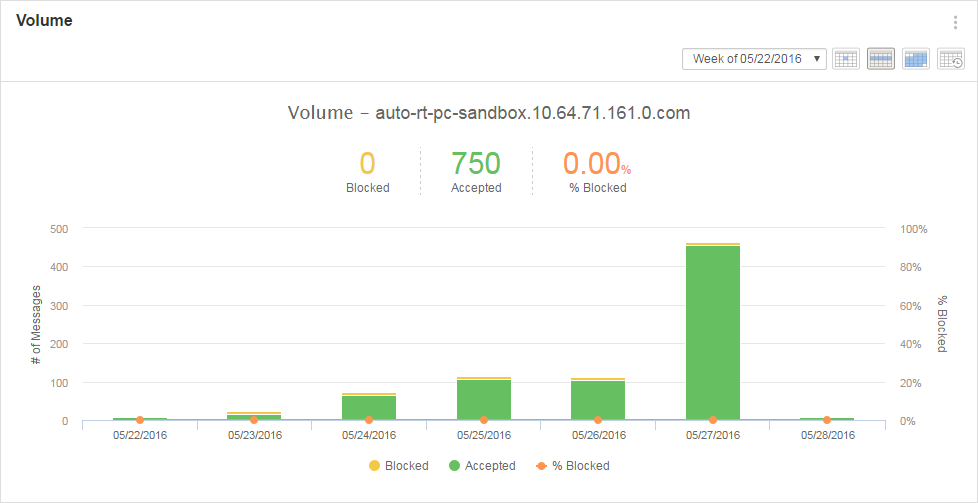
The Volume chart on the Summary tab of Dashboard displays the total number of accepted and blocked messages and the total percentage of blocked messages.

Select a time period by Date, Week, Month, or Last 12 months to show data for the selected time period.
The specified time period only affects the data shown on this chart and its corresponding thumbnail chart on the Threats tab. Changing these selections does not affect other charts.
The traffic direction slightly changes the data displayed on charts. The following is the specific data displayed:
|
Detected Values |
For Incoming Mail |
For Outgoing Mail |
|---|---|---|
|
Blocked |
The number of email messages blocked by connection-based filtering at the MTA connection level or by Hosted Email Security incoming security filtering Note:
This value does not include messages blocked by content-based filtering. |
The number of messages blocked using Hosted Email Security relay mail service filtering Possible reasons for blocking include:
|
|
Accepted |
The number of email messages passed by connection-based filtering at the MTA connection level or by Hosted Email Security incoming security filtering |
The number of messages passed by Hosted Email Security relay mail service filtering |
|
Blocked % |
The percentage of email messages blocked by connection-based filtering at the MTA connection level or by Hosted Email Security incoming security filtering |
The percentage of messages blocked by Hosted Email Security relay mail service filtering |
|
Total |
The total number of email messages processed |
|


