|
|
|

|
Call-out
|
Description
|
|---|---|
|
1
|
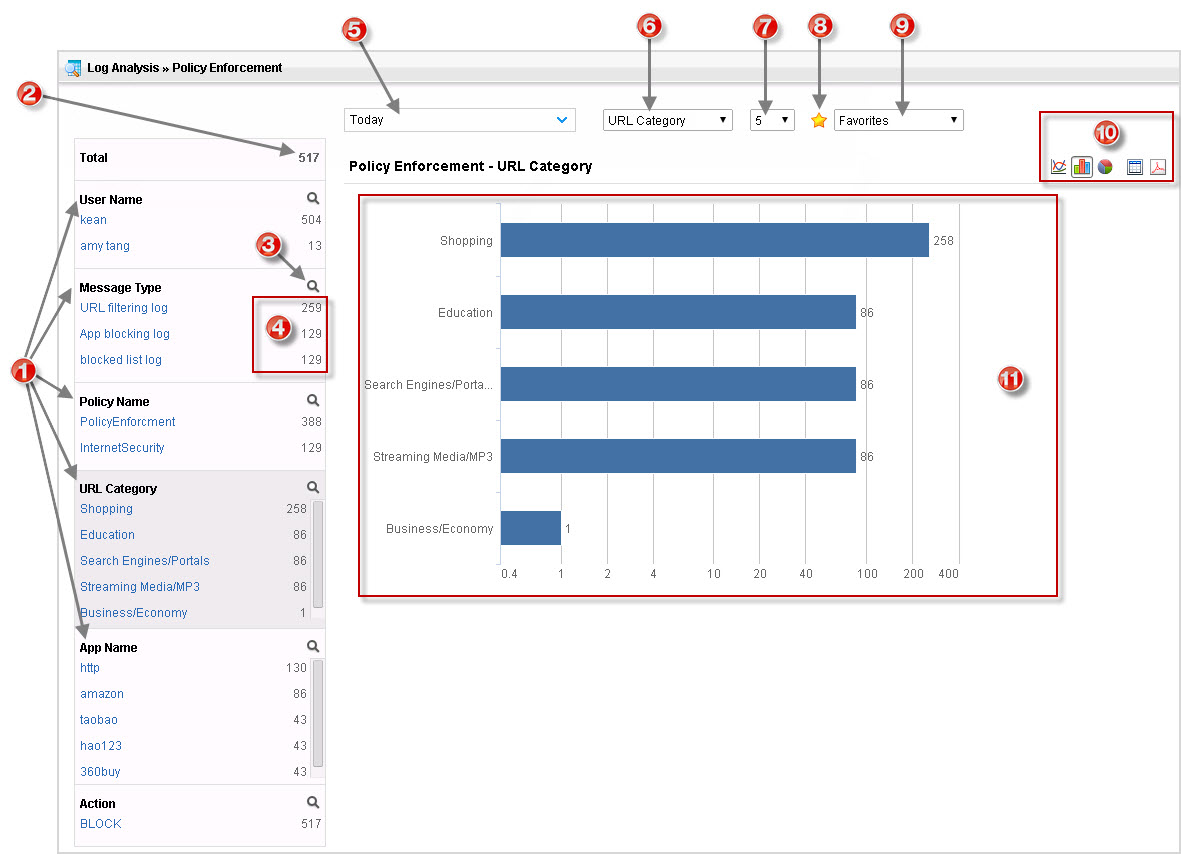
Click any entity to display its collected logs.
|
|
2
|
View the total number of policy violations or detections.
|
|
3
|
Click
|
|
4
|
View the count for each item. Each log screen represents different log data.
|
|
5
|
Select the time range to show logs.
|
|
6
|
Select a filtering option for how the logs display.
|
|
7
|
Select the most relevant logs to display. For example, select the top 10 policy
violations in Policy Enforcement.
|
|
8
|
Add a new favorite to bookmark the log results for reporting.
|
|
9
|
Select from the saved favorites to view and analyze updated logs.
|
|
10
|
Control the graphical layout. The options include: bar graph, line graph, pie
chart, table, and PDF.
|
|
11
|
Analyze log results for specified filters shown in the selected graphical
representation.
|